We have a rich heritage in the design and manufacturing of initiators, detonators and other Electro-Explosive Devices (EED) dating back to the 1960’s. A typical design requirement1 for all PacSci EMC EED components is their sensitivity to an input stimulus, commonly defined as the device “no-fire” and “all-fire” levels. While these terms may be new to those unfamiliar with the energetics industry, anyone dealing with ordnance devices should have at least a beginner’s understanding of an EED’s no-fire and all-fire characteristics, and their relationship to the device safety and functional performance.
Why use an Initiator?
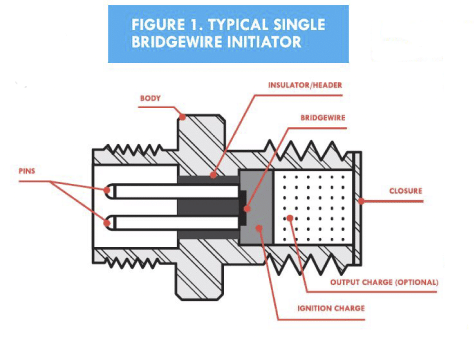
To comprehend what the no-fire and all-fire levels entail, it is important to understand how an initiator works. We define an initiator as any single discrete device or subassembly whose actuation is caused by the application of electric energy which in turn ignites a pyrotechnic or explosive material contained therein, as shown in Figures 1-2. Although existing initiator technologies include: Hot-Wire initiators, Exploding Bridgewire (EBW) detonators, Reactive Semiconductor Bridge (RSCB) initiators and Exploding Foil Initiators (EFI), for the purpose of simplicity, we will limit our discussion to Hot-Wire initiators; the most common type of EEDin use. In a Hot-Wire initiator, an external power source supplies a firing current directly to the initiator’s heat sensitive element commonly known as a bridgewire. The bridgewire is then heated by the direct application of energy, until reaching the ignition temperature of the ordnance compound surrounding it. The reaction may directly drive an output or may act as the ignition agent driving other ordnance compounds until a final output is yielded. Regardless of the type of initiator device used in an application, it is imperative to know the maximum electric stimulus that can be supplied which shall not ignite the device, therefore providing a reliable level of safety to the user, or what is the minimum eLectric stimulus required to guarantee its functional performance.

No-Fire & All-Fire Defined
Sensitivity tests are often used to estimate continuous variables which cannot be measured or non-destructively determined, e.g. the sensitivity of an initiator to an electric current input. For each test specimen, a critical current level or threshold is assumed. Electric current inputs larger than the threshold will always ignite the specimen, while current inputs lower than the threshold will not yield an ignition. However, repeated testing of any one sample would not be possible, since a current input that is not sufficient to cause the test specimen to initiate will generally damage the specimen to some extent. Therefore, in order to measure the initiation parameters of the underlying distribution, e.g. mean and standard deviation, the initiator samples need to be tested at different current input levels and their response or lack thereof
documented.

No-fire is defined as the maximum electric stimulus which can be applied for a specific time to a bridgewire without firing the initiator. The typical no-fire design requirement is a one (1) Ampere minimum with an associated one (1) Watt minimum applied to the initiator’s bridgewire circuit for a duration of five (5) minutes, and which does not cause the initiation of more than 1% of the device population at a confidence level of 95%. The test samples are typically divided into groups and temperature conditioned at 70°F or 225°F. This information is important in understanding how to safely operate the device. It is also critical in avoiding any unintentional activity due to electrical noise or
other inadvertent stimulus in the system.
All-fire is defined as the minimum electric stimulus that will always ignite the primary charge in an initiator. The typical all-fire design requirement is a 50 millisecond pulse at the minimum allfire level which causes the device population to initiate not less than 99.0% of the time at a confidence level of 95%. The test samples are typically divided into groups and temperature conditioned at -80°F, +70°F or +225°F. This information provides the necessary knowledge to the end user in order to properly incorporate the device into their system and guarantee its proper function. Often, the system level power allocation is critical for customers, and having a reliable all-fire level lessens power waste, ultimately leading to a more efficient and reliable system.
Determining Response Levels
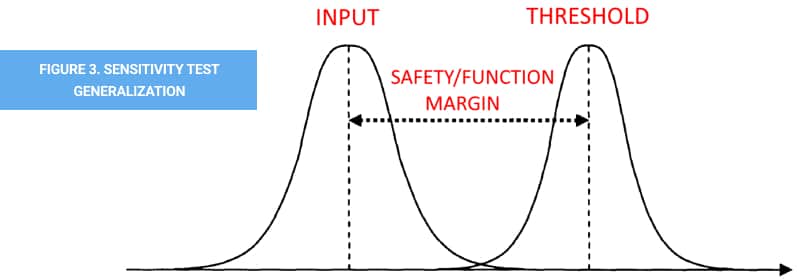
There is currently no single methodology capable of exactly determining an initiator’s no-fire or all-fire response. As such, determining the no-fire and all-fire levels of the device requires destructive testing, which is typically costly and time-consuming. Therefore, it is important to determine these levels in the most efficient way possible. Various test methods, such as, Probit Analysis2, have been created and applied in the past to statistically determine a test specimen’s safety and reliability characteristics3. Today, the most commonly used methods applicable to EEDs are: the Bruceton, Langlie and Neyer sensitivity tests. In general, all the test methods operate similarly; a probability distribution function is assumed, e.g. normal distribution, an initial stimulus is tested, the response is documented and influences the stimulus level of the following test(s) until a convergence occurs between the input stimulus and the device’s ignition threshold, as shown in Figure 3. The results of all the tests are analyzed to determine the mean, standard deviation, reliability and confidence level of the response level, effectively determining the no-fire and/or all-fire characteristics. While there are some similarities between the test methods, each has its advantages and disadvantages.

Sensitivity Test Methods Explained
The Probit (probability unit) method, conceptualized in 1934 by Chester Bliss4 and further expanded by David Finney in 1952, is a type of regression model used to analyze binomial (go/nogo, head or tails, all or nothing) response variables. It transforms the sigmoid (S-shape) input-response curve to a straight line that can then be analyzed by regression either through least squares or maximum likelihood methods. Probit analysis can be conducted by one of three techniques: using tables to estimate the probits and fitting the relationship by eye, hand calculating the probits, regression coefficient, and confidence intervals, or having a statistical package such as SPSS, SAS or R do it all
for you. Although this is the simplest sensitivity test to perform and provides a straightforward method to analyze the data, it generally requires many more samples than other tests because it does not concentrate the testing where the most information can be obtained. In addition, for the method to work somewhat efficiently, it requires that both mean and standard deviation of the population be well known in advance so that the testing can be conducted in the range of stimulus levels which allow convergence.
The Bruceton (up-and-down) method, published in 1948 by Dixon and Mood5, relies on simple calculations which can be done without the aid of a computer, and are based on an initial guess close to the population mean and a constant step size approximately equal to the standard deviation. It is generally more efficient than the Probit method since it concentrates the testing close to the population mean. However, the Bruceton method is very sensitive to the selected step size. If the step size is much bigger than the standard deviation, then none of the test will concentrate near the mean. On the other hand, if the step size is much smaller than the standard deviation and the initial guess is not near the true mean of the population, this method will not quickly converge to a final value, which can be costly due to extended testing.
The Langlie (one-shot) method, published in 1962 by Langlie6, efficiently provides accurate values for mean and standard deviation, without requiring that an initial guess be selected close to the population standard deviation. The Langlie approach is to bound the estimated mean by selecting an upper and lower limit. However, convergence of the method requires the certainty that none of the test samples will initiate at the lower limit, while ensuring that all the test samples will initiate at the upper limit. Once the upper and lower limits are chosen, the first stimulus level is chosen halfway between the limits interval. If the test interval is inappropriately chosen, then the stress levels will tend
to converge towards either the lower or the upper limit. In such a case, convergence to the lower limit would be indicative of an incorrect stimulus selection, and little will be learned, while convergence toward the upper limit can be shown statistically acceptable by use of the likelihood ratio test method. The main problem with the Langlie method is that it concentrates the test levels too close to the mean, which results in the inefficient determination of the standard deviation of the population.
The Neyer D-Optimal method, published in 1994 by Neyer7, is the most efficient of all methods requiring the smallest test sample size and only three parameters; lower and upper limits and an estimate of the standard deviation. It was designed to extract the maximum amount of statistical information from the test sample. Unlike previous methods which only required paper and pencil, the Neyer D-Optimal test requires detailed computer calculations to determine the test levels. In addition, the test method uses the results of all the previous test results to compute the next test level. The test method uses a three-step approach to establish the mean and standard deviation. First, the test algorithm “closes in” on the region of interest to within a few standard deviations of the mean. Second, the test algorithm determines the unique estimates of the parameters efficiently. Finally, the test continuously refines the estimates once convergence has been established.
To summarize, the efficiency of the Bruceton method is strongly dependent on the choice of step size. The efficiency of the Langlie method is somewhat dependent on the spacing between the upper and lower test levels. The Neyer D-Optimal test is essentially independent of the choice of parameters.
At PacSci EMC, we use the Neyer D-Optimal sensitivity test method to determine EEDs8 no-fire and all-fire characteristics due to its efficiency, accuracy and proven reliability.
Safety & Reliability at PacSci EMC
PacSci EMC’s highest priority is the safety and reliability of our products. Having clear and accurately defined all-fire and no-fire characteristics guarantees that our customers can safely operate our products as intended. These well-defined parameters also ensure our initiators and other EED’s will work reliably when required. Whether the application is in Space, Defense, Oil and Gas, or any other field, PacSci EMC guarantees that our product will work with the highest safety and reliability, on command, when commanded.
References
1. MIL-DTL-23659F, General Design Specification for Electrical Initiators
2. Finney, D. J., Ed. (1952), Probit Analysis, Cambridge, England, Cambridge University Press.
3. NAVORD Report 2101, Statistical Methods Appropriate for Evaluation of Fuze Explosive-Train Safety and Reliability.
4. Greenberg, B. G. (1980), Chester I. Bliss, 1899-1979, International Statistical Review / Revue Internationale de Statistique, 8(1): 135-136.
5. Dixon, J.W. and Mood, A.M. (1948), A Method for Obtaining and Analyzing Sensitivity Data, Journal of the American Statistical Association, Vol. 43, pp. 109–126.
6. Langlie, H.J., (1962), A Reliability Test Method for “One-Shot” Items, Proceedings of the Eighth Conference on the Design of Experiments in Army Research Development and Testing, Washington, D.C., October 24-26, 1962.
7. Barry T. Neyer, A D-Optimality-Based Sensitivity Test, Technometrics, Vol. 36: No. 1 (1994), pp. 61-70.
8. https://psemc.com/resources/pyrotechnic-glossary/